Plots
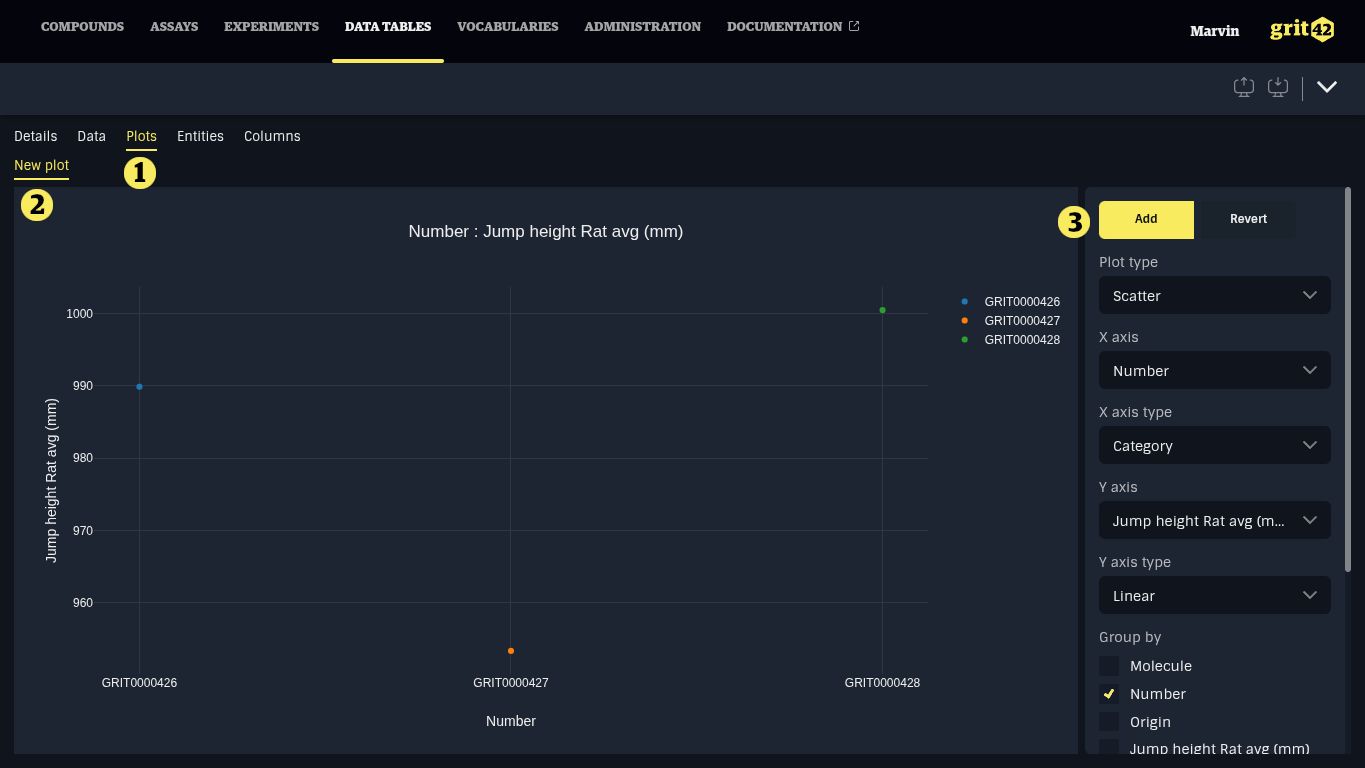
Data table data can be visualised in grit with plots. Plots are managed under the Plots tab (1). To add a new plot, click the New plot tab (2), configure the plot and click Save (3)
Data table plots work the same way as Experiment plots. A detailed configuration guide can be found under Assays > Running > Plots