Data Tables
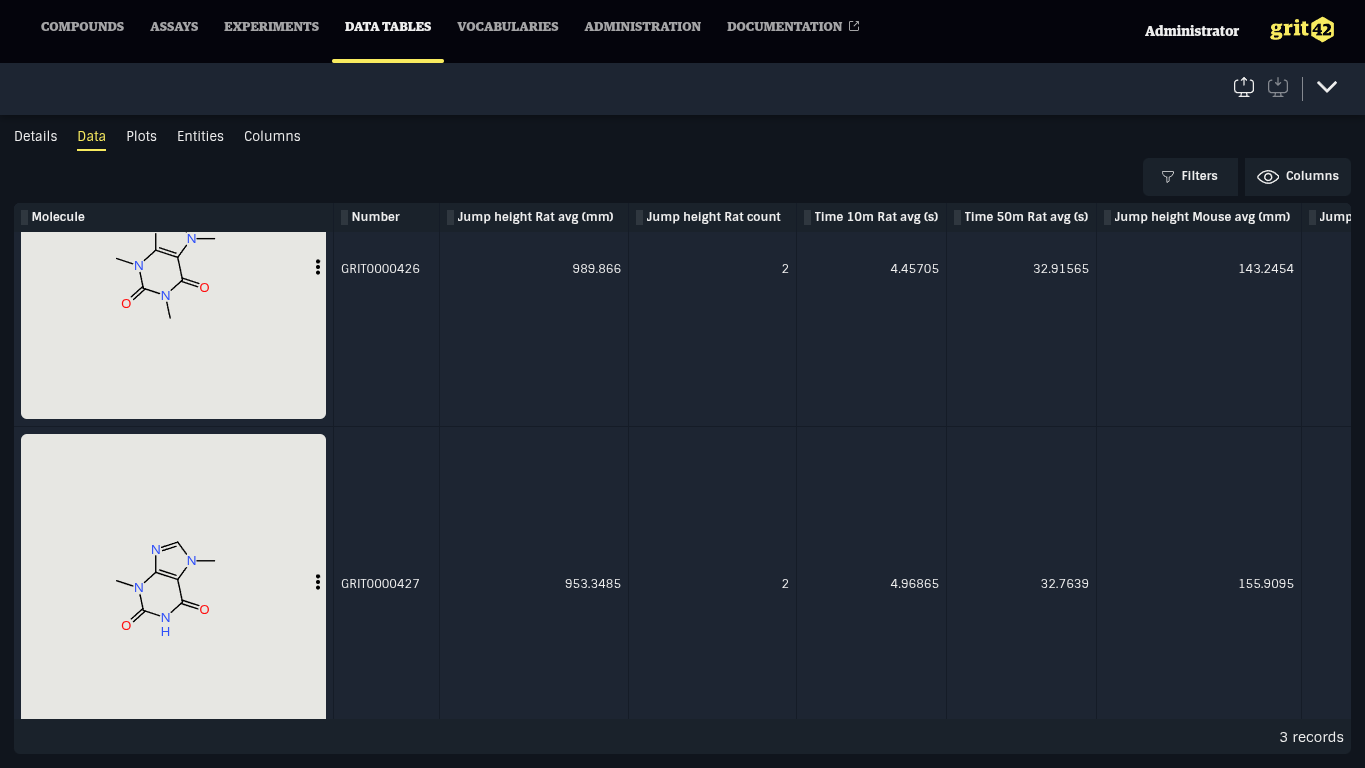
Data tables provide scientists and data managers with a structured way to aggregate and analyse experimental data. They are designed in a format inspired by Structure–Activity Relationship (SAR) tables, enabling efficient comparison and interpretation of results across multiple experiments.
At a high level, a data table consists of:
- Entities – records of a configured source data type, one row per record.
- Columns – representing assay data sheet columns.
The table is populated using experimental data corresponding to the selected entities and assay columns. Filtering and aggregation settings determine which data are included and how they are presented.
Where multiple values exist for a given entity and assay column pair, the system applies an aggregation method. Supported aggregation methods depend on the column data type and may include: minimum, maximum, average, count, standard deviation, sum, comma-separated list, and latest updated.
If assays are associated with metadata, these values can be used as filters to refine the aggregated results. This makes it possible to focus on experiments with specific metadata characteristics. In addition, subject attributes can be displayed within the table to provide contextual information.
Once constructed, a data table can be explored interactively. Users can filter and sort the results, generate plots for visual analysis, and export the dataset as a CSV file for use in external analysis tools.
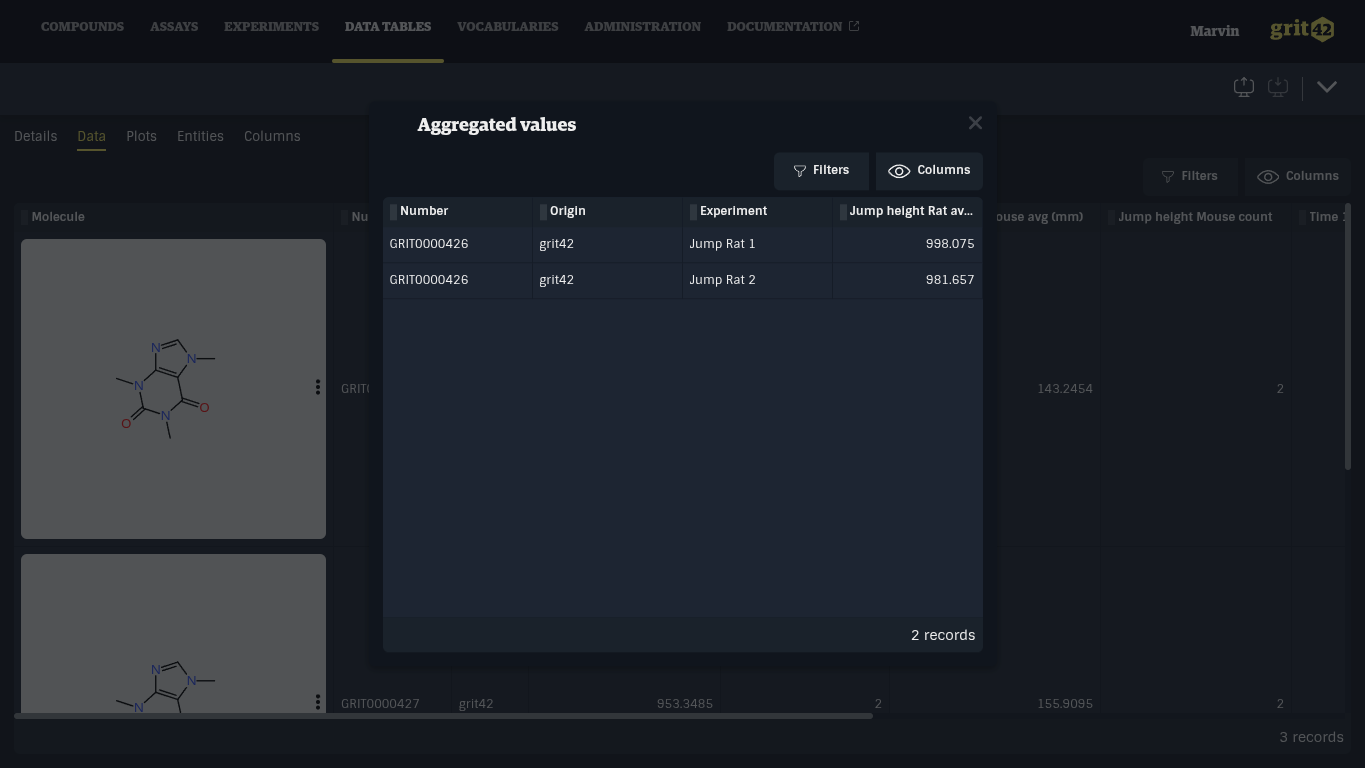
Clicking on a cell with experimental data opens a dialog showing all aggregated values. Clicking a row in this table will navigate to the Experiment data sheet.
📄️ Entities
Entities are the entry point for rows displayed in data tables. Rows represent selected records of the entity data type selected when creating a data table.
📄️ Entity attribute columns
Entity attributes columns enable displaying entity (meta)data, such as a compound structure or molecular formula, in Data Tables. They are managed under the Columns > Entity attributes tab (1).
📄️ Assay Data Sheet columns
Data tables Assay Data Sheet columns display experimental data. Assay Data Sheet columns are selected from Assay Models and aggregate data from Published experiments belonging to the Assay Model. Assays filter can be configured to aggregate data from specific Assays.
📄️ Plots
Data table data can be visualised in grit with plots. Plots are managed under the Plots tab (1).