Adding plots to experiments
To add one or more plots to the experiment go to the "Plots" tab 1).
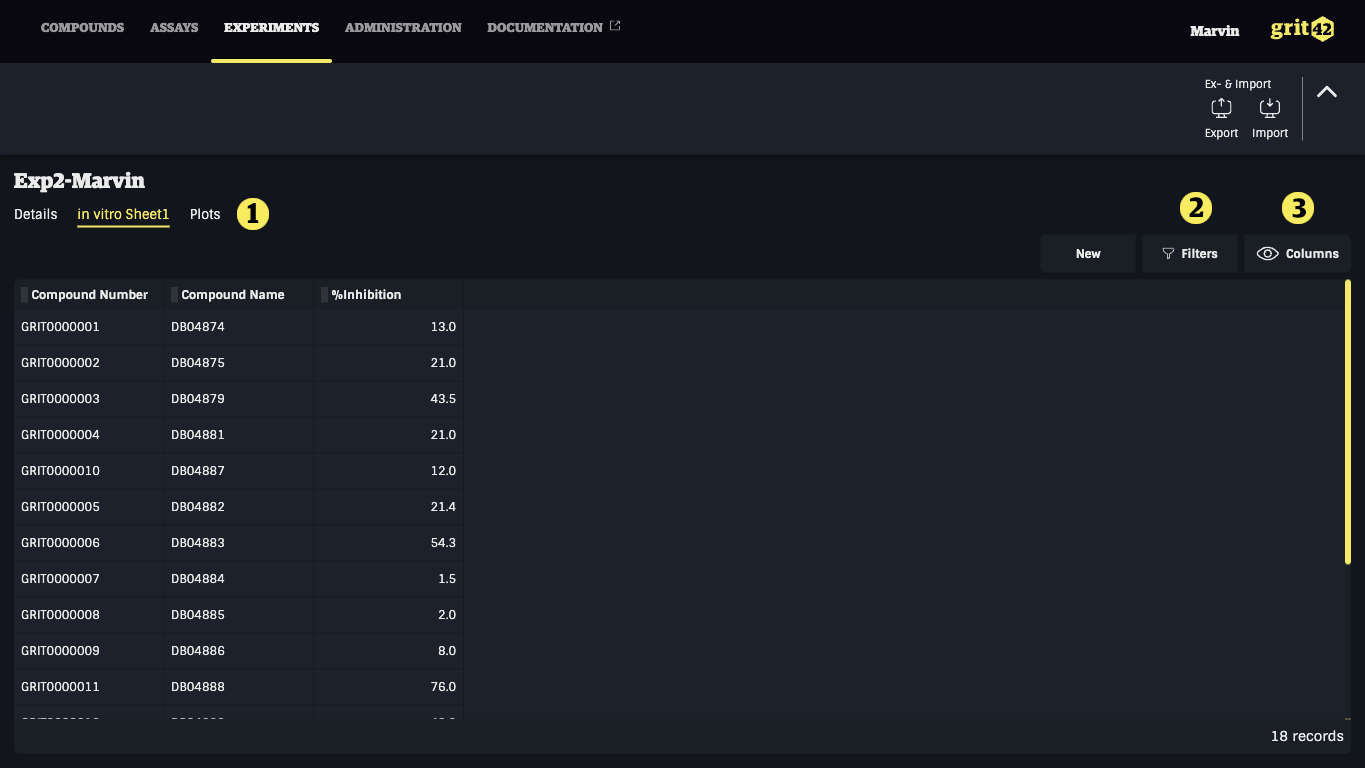
On the plots tab you can one or more plots. To add one more click the "New plot" tab.
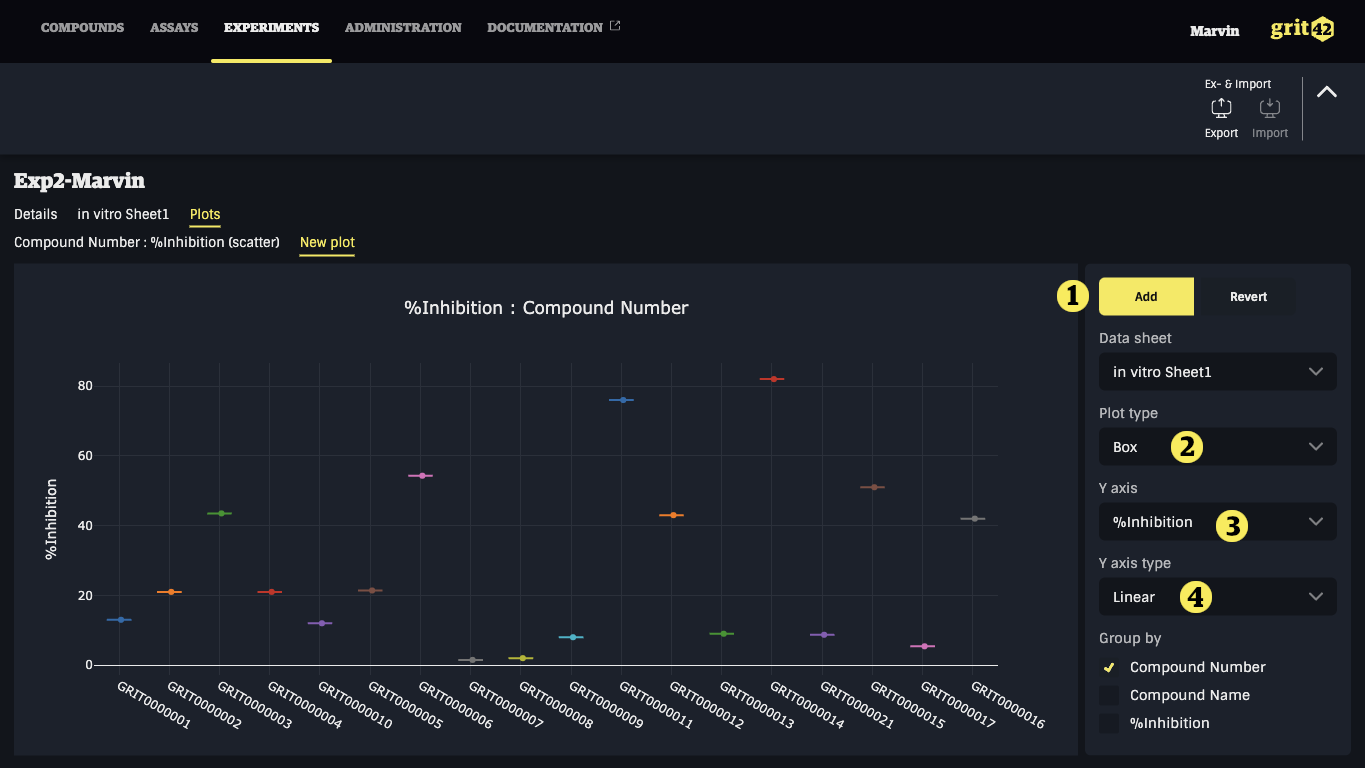
The platform currently support scatter and box plots but many more can be implemented from the plot library if the need arise.
- When the plot is defined correctly do remember to click "Add" to save it to the experiment
- Select the plot type - box or scatter
- Select the values for the Y axis
- Select the data type / format of the data on the Y axis
In this plot the values are grouped by (there's only one value per compound in this case) the compound number.
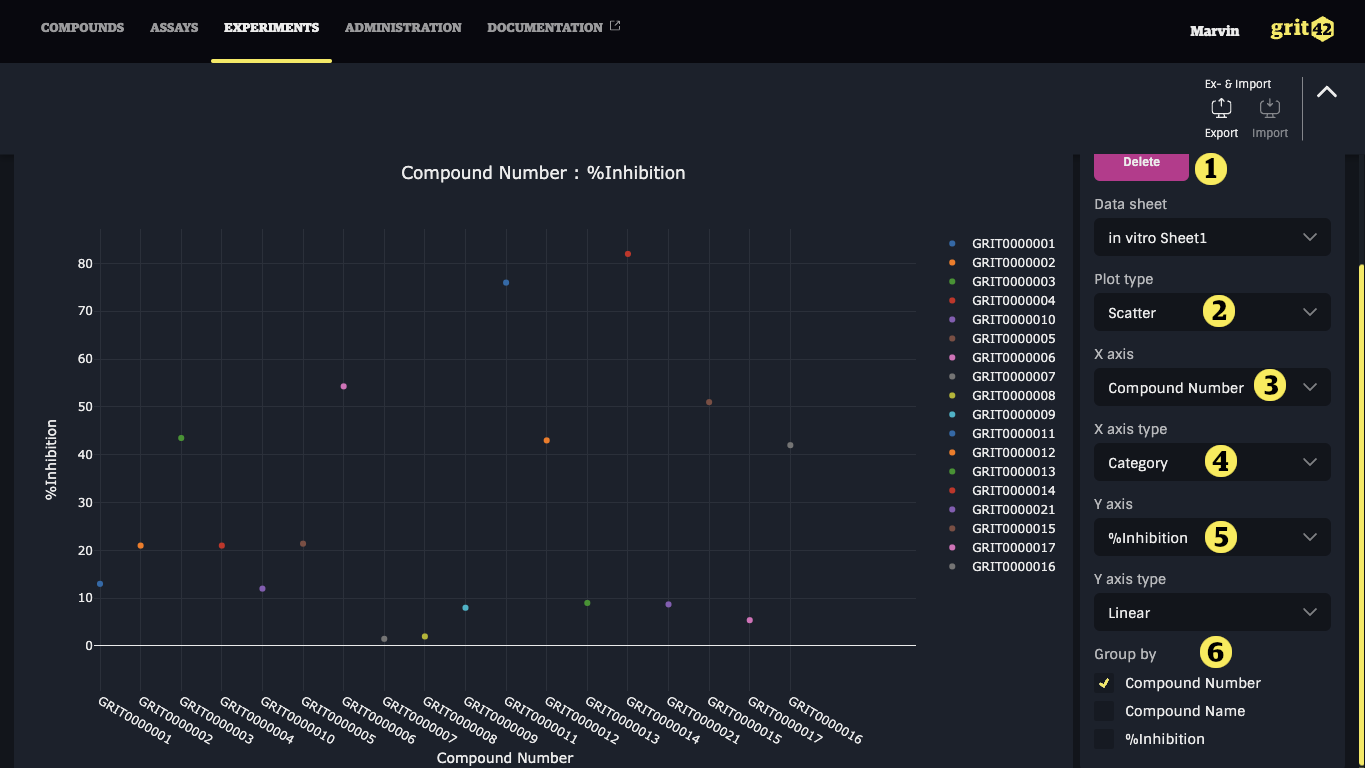
If you later open a saved plot again you can edit or delete it from the experiment.
- Add button has now changed to a delete button
- Plot type selected
- Compound number selected as X axis
- As X axis is not a number and hence type needs to be set to "Category"
- Values selected for the Y axis
- A scatter plot is "just" dots in same colour. By making a "group by" compound number each dot gets its own colour